Are you worried about your .NET webapp running out of memory? In order to let your .NET (web) application run smooth over a longer period of time, it is important to monitor the .NET CLR Garbage Collector (GC) and collection. The what? The .NET Common Language Runtime Garbage Collector. Here is how you can monitor this in a Zabbix template using Powershell WMI / CIM and Win32_PerfRawData_NETFramework_NETCLRMemory Windows Performance Counters.
Whether you run a .NET web application or administer a webserver that hosts .NET web applications, it is important to keep an eye out for memory usage. As developers and systems administrators we're all too familiar with OutOfMemoryException. As the name suggests, the exception is thrown when a .NET application runs out of memory, something you don't want to happen.
Microsoft explains the fundamentals of garbage collection, memory allocation and release. As either a .NET developer or systems administrator, we're all too familiar with - as I call it - memory pollution. Suddenly your .NET web application throws an "OutOfMemoryException", and you have no idea why. Remember The Dangers of the Large Object Heap? Monitor your .NET web application's memory usage in Zabbix to understand where memory goes.
Fortunately, you can use Zabbix and a bit of PowerShell and CIM (Common Information Model - successor to WMI or Windows Management Interface) to query various bits 'n pieces in the Windows Server operating system and .NET pipeline. Some key metrics to keep an eye out are:
- AllocatedBytesPersec
- Gen0heapsize
- Gen0PromotedBytesPerSec
- Gen1heapsize
- Gen1PromotedBytesPerSec
- Gen2heapsize
- LargeObjectHeapsize
- NumberTotalcommittedBytes
- NumberTotalreservedBytes
- PercentTimeinGC
You find these in the Win32_PerfRawData_NETFramework_NETCLRMemory performance counter. But you need a bit of PowerShell to get the right data.
Here is how to create Zabbix monitoring for Win32_PerfRawData_NETFramework_NETCLRMemory in your IIS website templates. For example, monitor the "Large Object Heap Size" performance counter to gain insight in how many bytes are allocated to the large object heap. The same for Gen0PromotedBytesPerSec and Gen1PromotedBytesPerSec performance counters. These counters display the bytes per second that are promoted from generation 0 (youngest) to generation 1, and generation 1 to generation 2 (oldest). Memory is promoted when it survives a garbage collection. You can collect all this information using WMI and PowerShell.
Many of the steps to follow are the same as they are in part 3 of this series, see the link above. Therefore I'll provide you with the relevants to query Windows Win32_PerfRawData_NETFramework_NETCLRMemory Performance Counters and you can repeat the earlier steps.
Get all application pools by querying WMI root\webadministration namespace
This queries Windows Management Instrumentation (WMI) root\webadministration namespace for all application pools and saves into an object $allpools.
$allpools = (
  Get-CimInstance
    -EA SilentlyContinue
    -ClassName applicationpool
    -Namespace root\webadministration
).Name
You do need to put this in one line.
Query WMI for all application pool's process id's
You also need to have the process id belonging to an application pool, query the same root\webadministration namespace:
$allprocids = (
  Get-CimInstance
    -EA SilentlyContinue
    -ClassName WorkerProcess
    -Namespace root\webadministration
) | Select AppPoolName,ProcessId
Process queried Win32_PerfRawData_NETFramework_NETCLRMemory properties
This is (part 1 of) where the real magic happens. I'll post the code for you first:
function get-WmiNetClrMem($wpname) {
  Try {
    $procid = ($allprocids | Where-Object AppPoolName -eq "${wpname}").ProcessId
    $data = ($netclrmemory | Where-Object ProcessID -eq $procid)
    $hashtable = @{
      AllocatedBytesPersec = $data.AllocatedBytesPersec
      Gen0heapsize = $data.Gen0heapsize
      Gen0PromotedBytesPerSec = $data.Gen0PromotedBytesPerSec
      Gen1heapsize = $data.Gen1heapsize
      Gen1PromotedBytesPerSec = $data.Gen1PromotedBytesPerSec
      Gen2heapsize = $data.Gen2heapsize
      LargeObjectHeapsize = $data.LargeObjectHeapsize
      NumberTotalcommittedBytes = $data.NumberTotalcommittedBytes
      NumberTotalreservedBytes = $data.NumberTotalreservedBytes
      PercentTimeinGC = $data.PercentTimeinGC
    }
    @($hashtable.keys) | % {
      if (-not $hashtable[$_]) { $hashtable.Remove($_) }
    }
    return $hashtable
  }
  Catch {
  }
}
A lot is going on here:
- The ProcessId property for the application pool currently queried is selected from all Process ID's:
$procid = ($allprocids | Where-Object AppPoolName -eq "${wpname}").ProcessId
- That
$procidproperty then is used to match a ProcessID in the object$netclrmemory(we'll come to that one later), and is saved in object $data:$data = ($netclrmemory | Where-Object ProcessID -eq $procid)
- All WMI properties we want are filtered out the $data object and saved into a hashtable
- The hashtable is stripped from empty values;
ConvertTo-Jsonreturns the JSON representation ofnullwhen the input object is$null. Zabbix then sees this as an string, which fails when you're expecting an integer. - The hashtable is returned, having valid values for
- AllocatedBytesPersec
- Gen0heapsize
- Gen0PromotedBytesPerSec
- Gen1heapsize
- Gen1PromotedBytesPerSec
- Gen2heapsize
- LargeObjectHeapsize
- NumberTotalcommittedBytes
- NumberTotalreservedBytes
- PercentTimeinGC
Or less if a property didn't have a value.
Now for part 2 of the magic.
Query WMI for all required Win32_PerfRawData_NETFramework_NETCLRMemory properties
This is where you actually query Windows Management Instrumentation (WMI) / CIM Win32_PerfRawData_NetFramework_NETCLRMemory for properties you want to monitor in Zabbix. Be creative.
$netclrmemory = (Get-CimInstance -EA SilentlyContinue -ClassName Win32_PerfRawData_NETFramework_NETCLRMemory -Filter "Name like 'w3wp%'") | select AllocatedBytesPersec,Gen0heapsize,Gen1heapsize,Gen2heapsize,LargeObjectHeapsize,NumberTotalcommittedBytes,NumberTotalreservedBytes,PercentTimeinGC,ProcessID,Gen0PromotedBytesPerSec,Gen1PromotedBytesPerSec
$netclrinfo = @{}
$allpools | foreach {
	$netclrinfo[$_] = get-WmiNetClrMem $_
}
$netclrinfo | ConvertTo-Json
Using Get-CimInstance, you query the aforementioned WMI Class, and filter on the process name like 'w3wp%', since you are only interested in IIS application pools - or worker processes. Output is saved in an object $netclrmemory, the one you noticed above.
A new hashtable object $netclrinfo is created, and you loop through $allpools in a foreach, executing the function get-WmiNetClrMem($wpname). The end result in hashtable $netclrinfo is then converted into an JSON string for Zabbix.
Here is the JSON output:
"reilink.nl(domain)(4.0)(pool)":  {
	"LargeObjectHeapsize":  74864,
	"Gen0heapsize":  1660248,
	"Gen2heapsize":  2805364,
	"Gen1heapsize":  341388,
	"NumberTotalreservedBytes":  33546240,
	"NumberTotalcommittedBytes":  7282688,
	"PercentTimeinGC":  48,
	"Gen0PromotedBytesPerSec":  114060,
	"Gen1PromotedBytesPerSec":  0,
	"AllocatedBytesPersec":  80405312
},
Here you can see 114060 bytes per second is promoted from Generation 0 garbage collection to Generation 1 ("Gen0PromotedBytesPerSec"). As Microsoft explains: Objects that are not reclaimed in a garbage collection are known as survivors and are promoted to the next generation.
Add the following XML to your template file:
<item_prototype>
	<name>.NET CLR Memory: Gen0heapsize</name>
	<type>DEPENDENT</type>
	<key>iis.apppool.Gen0heapsize[{#APPPOOLNAME}]</key>
	<delay>0</delay>
	<history>7d</history>
	<description>This counter displays the maximum bytes that can be allocated in generation 0 (Gen 0); its does not indicate the current number of bytes allocated in Gen 0. A Gen 0 GC is triggered when the allocations since the last GC exceed this size. The Gen 0 size is tuned by the Garbage Collector and can change during the execution of the application. At the end of a Gen 0 collection the size of the Gen 0 heap is infact 0 bytes; this counter displays the size (in bytes) of allocations that would trigger the next Gen 0 GC. This counter is updated at the end of a GC; its not updated on every allocation.</description>
	<units>B</units>
	<application_prototypes>
		<application_prototype>
			<name>{#APPPOOLNAME}</name>
		</application_prototype>
	</application_prototypes>
	<preprocessing>
		<step>
			<type>JSONPATH</type>
			<params>$.Gen0heapsize</params>
			<error_handler>DISCARD_VALUE</error_handler>
		</step>
		<step>
			<type>DISCARD_UNCHANGED_HEARTBEAT</type>
			<params>10m</params>
		</step>
	</preprocessing>
	<master_item>
		<key>netclrmemfetch[{#APPPOOLNAME}]</key>
	</master_item>
</item_prototype>
Repeat for other metrics, and you're all done!
Here are three graphs as an example:
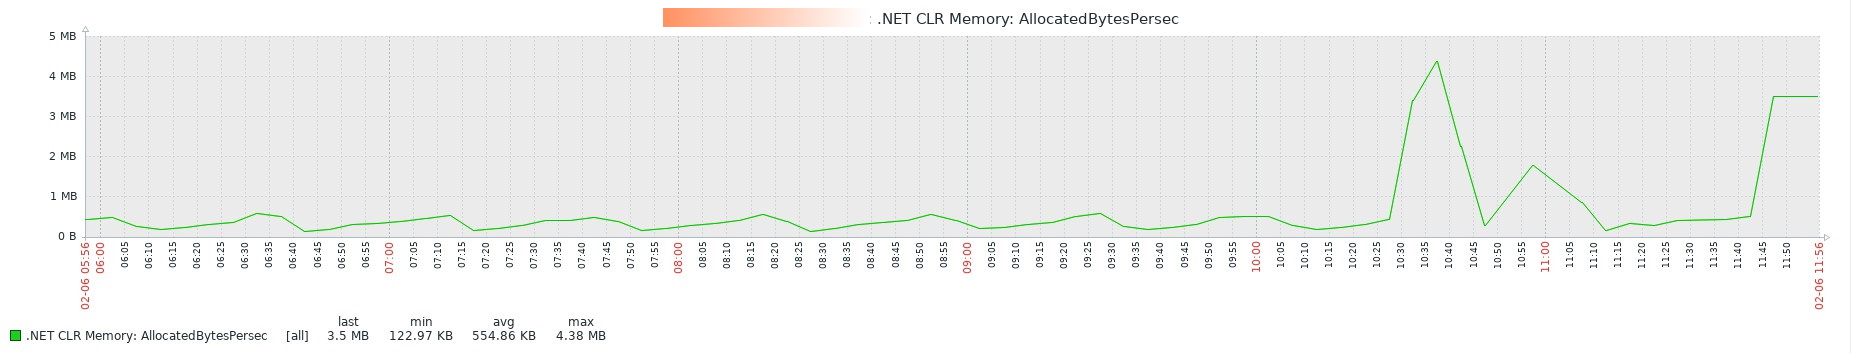
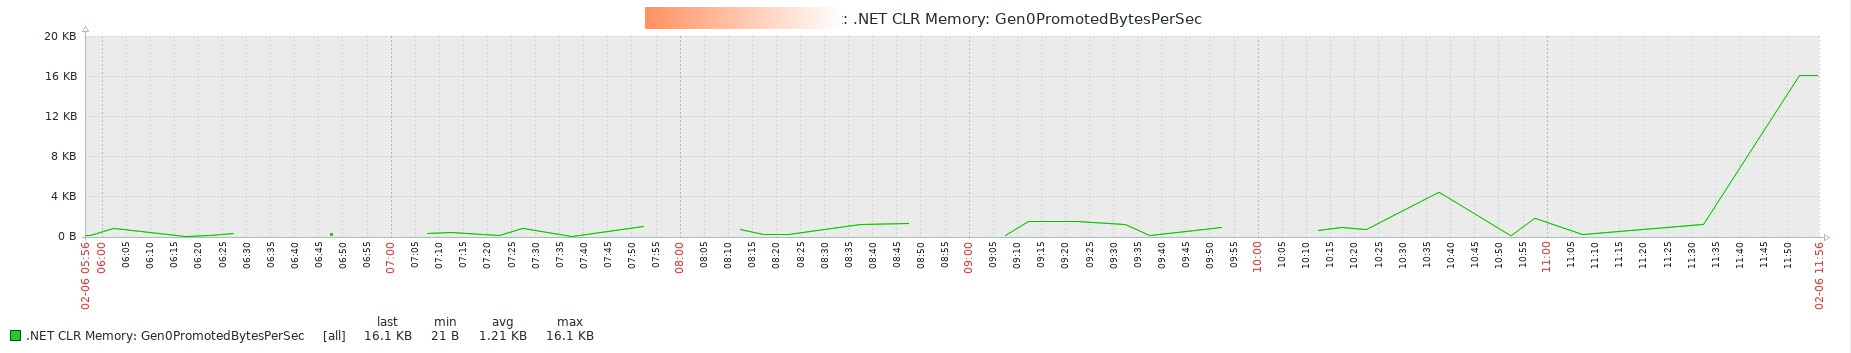
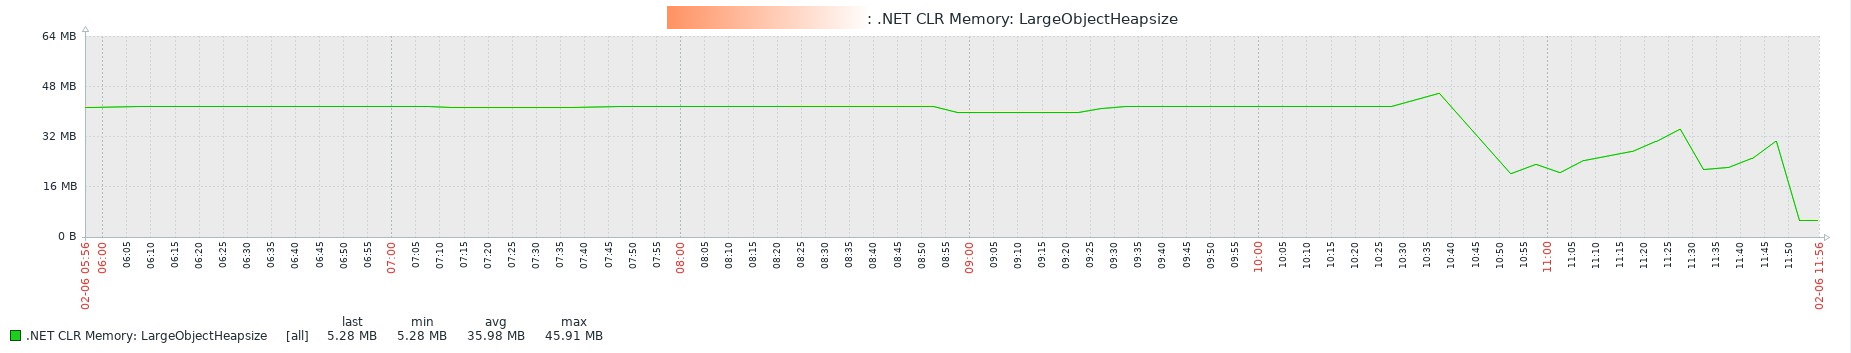
Keeping track of .NET memory usage enables you to optimize usage and performance further.

Thank you very much! <3 ❤️

Hi, my name is Jan. I am not a hacker, coder, developer or guru. I am merely an application manager / systems administrator, doing my daily thing at Embrace – The Human Cloud. In the past I worked at CLDIN (CLouDINfra) and Vevida. With over 20 years of experience, my specialties include Windows Server, IIS, Linux (CentOS, Debian), security, PHP, websites & optimization. I blog at https://www.saotn.org.
Pingback: ASP.NET performance: what to keep in mind
Pingback: Monitor website performance in IIS with Zabbix
Pingback: Getting more out your Windows Performance Counters monitoring for web applications - part 3