Address
304 North Cardinal St.
Dorchester Center, MA 02124
Work Hours
Monday to Friday: 7AM - 7PM
Weekend: 10AM - 5PM
Set up debugging symbols for WinDbg in Windows and debug BSOD like a boss.
Before you can properly debug crash and memory dumps in Windows (Windows 11, Windows 10, Windows Server), you need to install WinDbg -Windows Debugger- and its debugging symbols. In this article I explain how to set up these debugging symbols for WinDbg in Windows.
In this article I explain how to set up debugging symbols for WinDbg in Windows.
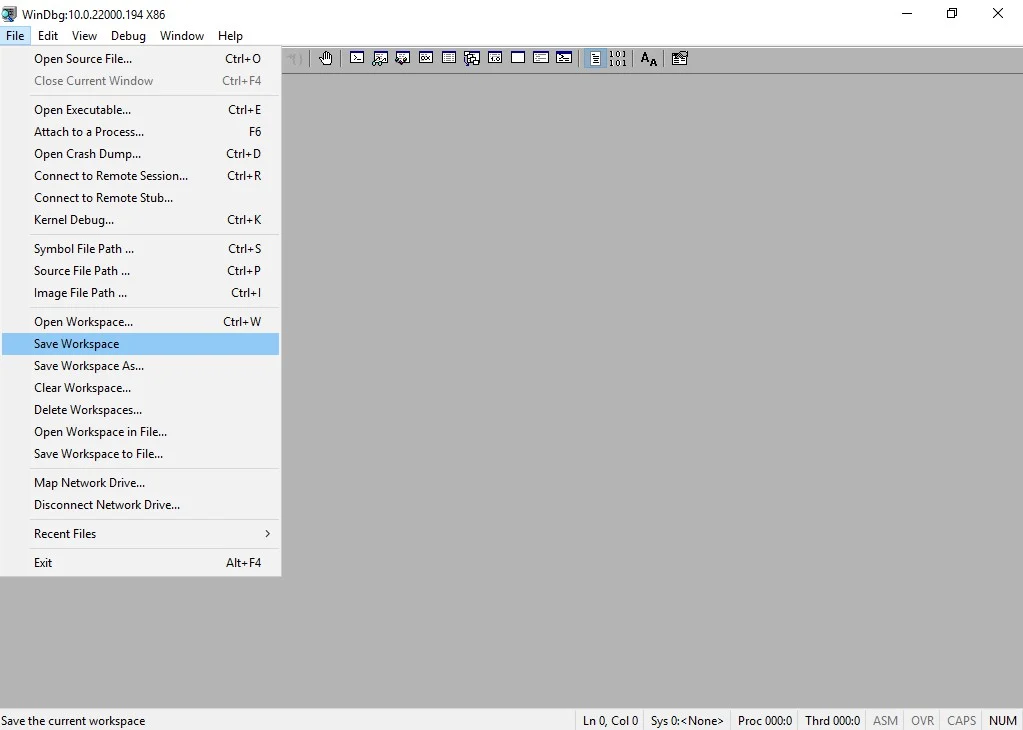
Assuming you’ve already installed WinDbg through the Windows SDK sdksetup.exe program, the steps to configure Windows debugging symbols in WinDbg are pretty easy and straightforward:
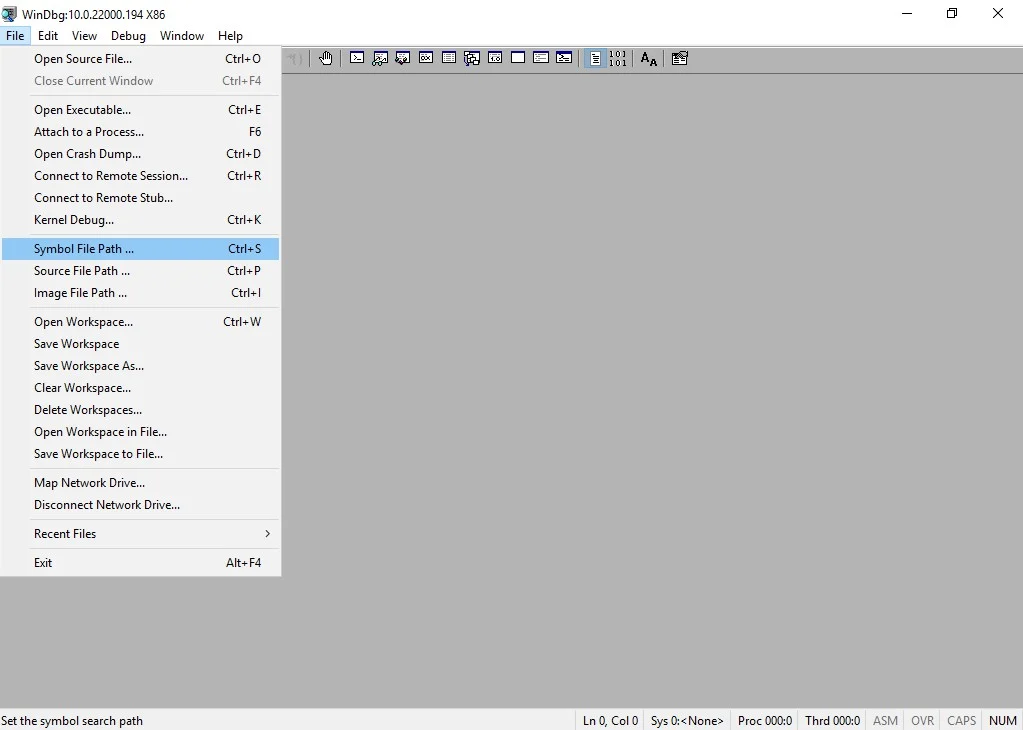
SRV*D:\SymCache*http://msdl.microsoft.com/download/symbols
The path D:\SymCache is specific to my environment. If the target folder of your choosing doesn’t yet exist, it’ll be created.
All done, now you can debug BSOD like a boss 🙂 .
Want to dive into fundamental concepts that are important for understanding debugging and troubleshooting complex issues on Windows? Then check out this GitHub repo by “DebugPrivilege“: https://github.com/DebugPrivilege/InsightEngineering. Each section goes beyond just the theory aspects, emphasizing practical examples using tools like Visual Studio, Process Explorer, and WinDbg.