Before you can properly debug crash and memory dumps in Windows (Windows 11, Windows 10, Windows Server), you need to install WinDbg -Windows Debugger- and its debugging symbols. In this article I explain how to set up these debugging symbols for WinDbg in Windows.
In this article I explain how to set up debugging symbols for WinDbg in Windows.
Assuming you’ve already installed WinDbg through the Windows SDK sdksetup.exe program, the steps to set debugging symbols path for WinDbg are pretty easy and straightforward:
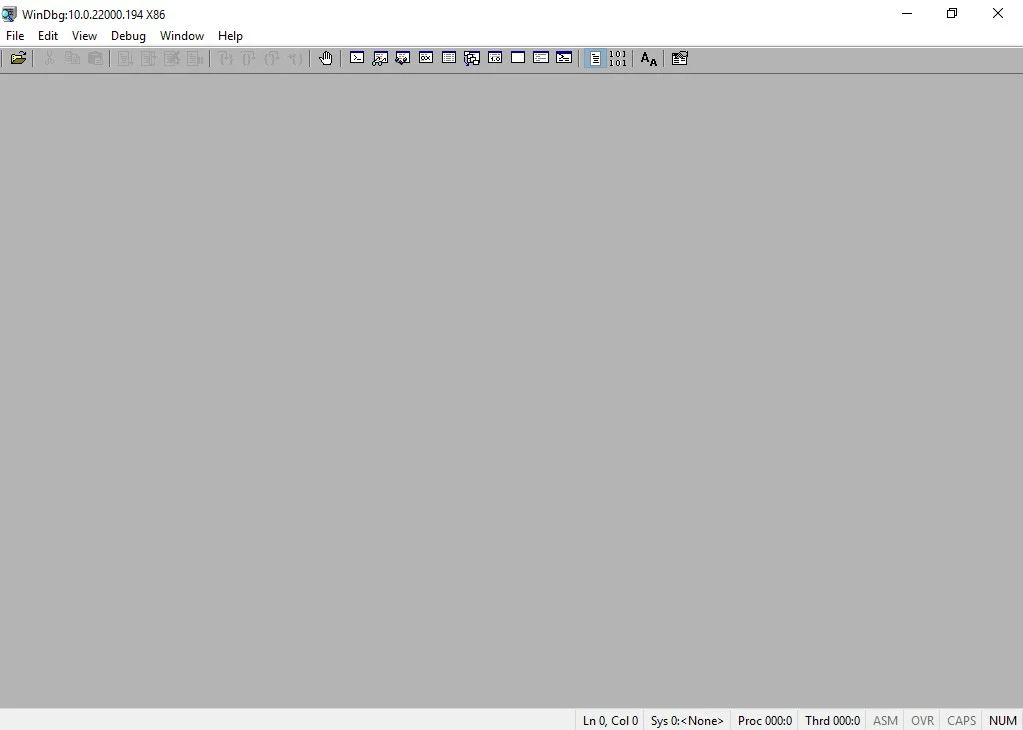
- Start WinDbg
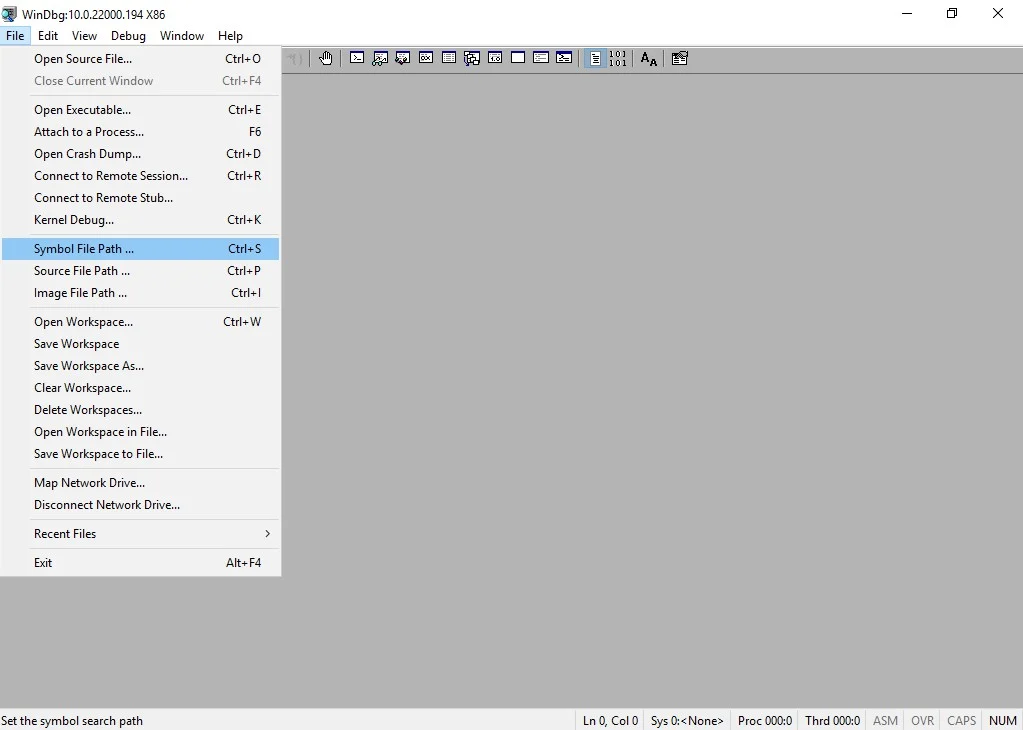
- Click File
- Click Symbol File Path (shortcode Ctrl+S)
- Fill in a new Symbol Path:
SRV*D:\SymCache*http://msdl.microsoft.com/download/symbols - Click OK
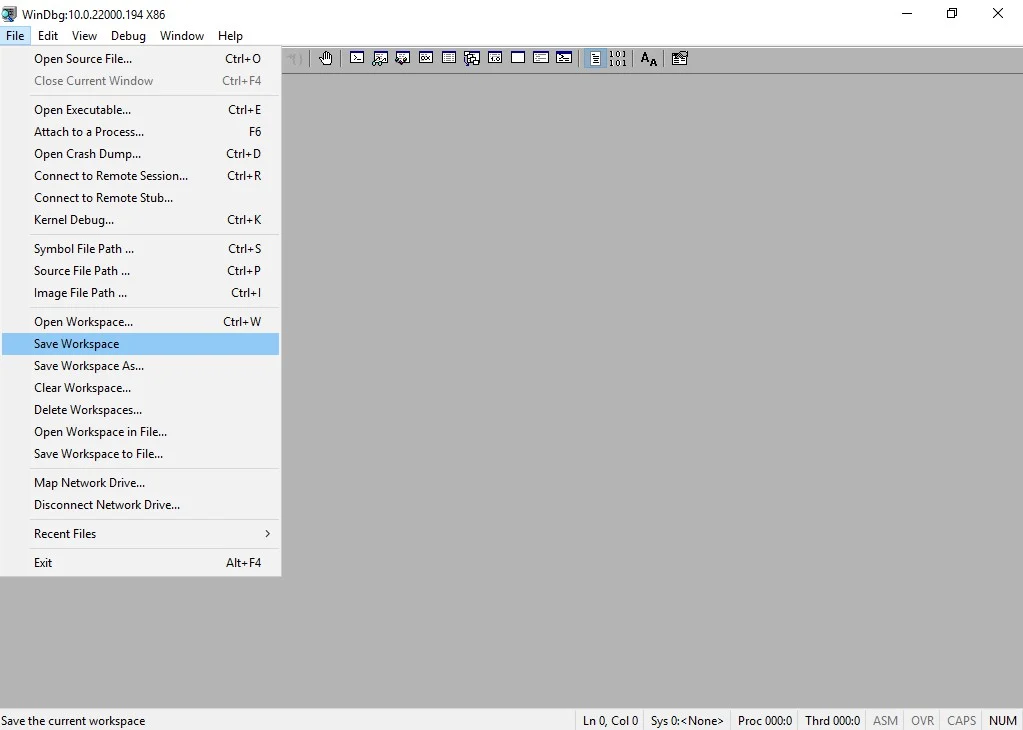
- Click Save Workspace in the File menu

The path D:\SymCache is specific to my environment. If the target folder of your choosing doesn’t yet exist, it’ll be created.
All done, now you can debug BSOD like a boss 🙂 .
Want to dive into fundamental concepts that are important for understanding debugging and troubleshooting complex issues on Windows? Then check out this GitHub repo by “DebugPrivilege“: https://github.com/DebugPrivilege/InsightEngineering. Each section goes beyond just the theory aspects, emphasizing practical examples using tools like Visual Studio, Process Explorer, and WinDbg.
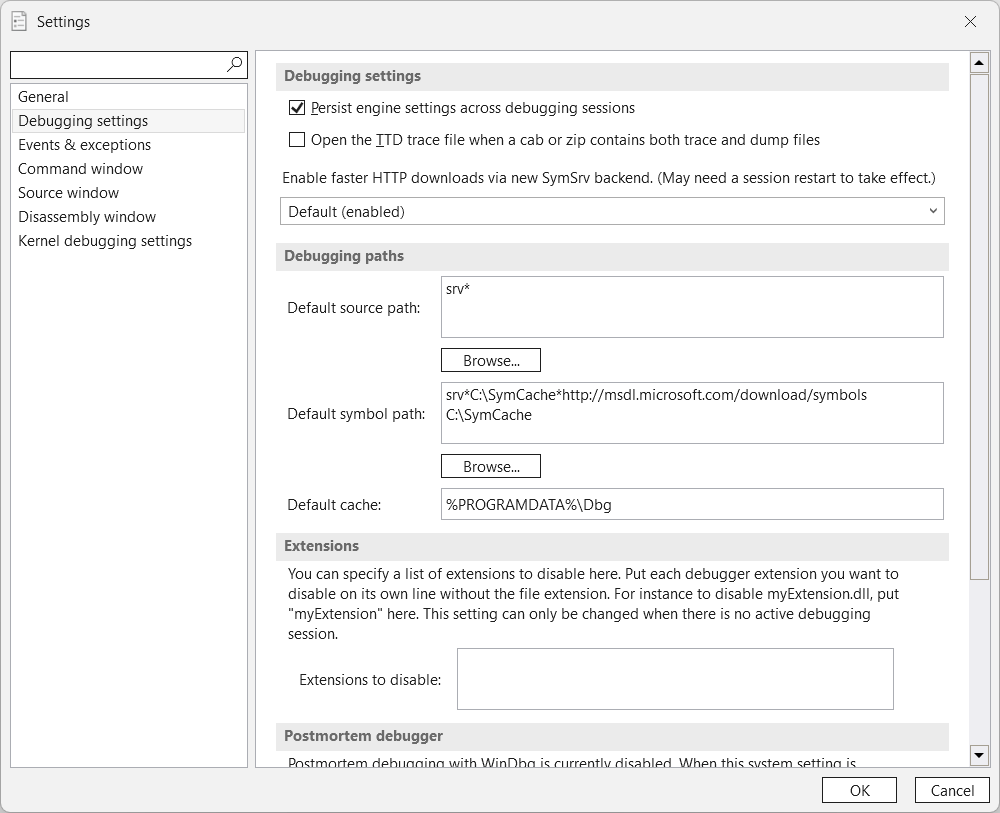
Set Symbol Path in WinDbg App 1.2506.12002.0
WinDbg App 1.2506.12002.0 has a different look and feel (jeej! 🙂 ), but the steps remain somewhat the same:
- click File
- click Settings
- click Debugging settings
- add the Default source path and Default symbol path location under Debugging paths and click OK
Conclusion
It is important to properly set-up WinDbg debugging symbols, because they allow you to:
- make crash dumps human-readable: Without symbols, WinDbg can’t show you meaningful function or variable names. You’ll see cryptic addresses and memory locations instead of helpful names like
nt!KeBugCheckEx. - see accurate call stacks. Symbols allow WinDbg to reconstruct the call stack properly. This is critical when trying to trace what function calls led up to the crash.
- understand parameters and locals. With symbols, you can examine function parameters and local variables to understand what caused the fault – for example, a null pointer or invalid memory reference.
- identify driver issues. If a third-party driver causes the crash, symbols help identify exactly which driver and even the exact line of code or function within it.
- use WinDbg commands effectively. Commands like
!analyze -v,k,kv,ln, anddtall rely on symbols to display meaningful information. Without symbols, these commands are mostly useless.
Summary
- Install WinDbg and configure debugging symbols to analyze crash dumps effectively.
- Set the Symbol Path in WinDbg using the specified command for easier debugging.
- Using correct symbols makes crash dumps readable and helps trace issues accurately.
- Symbols allow identification of driver-related problems and enhance command utility in WinDbg.
- Tailor the path based on your environment to ensure that all necessary files are accessible.

Did you like this post?
Please take a second to support Sysadmins of the North and donate!
Your generosity helps pay for the ongoing costs associated with running this website like coffee, hosting services, library mirrors, domain renewals, time for article research, and coffee, just to name a few.