
Before you can properly debug crash and memory dumps in Windows (Windows 11, Windows 10, Windows Server), you need to install WinDbg – Windows Debugger – and its debugging symbols. In this article I explain how to configure WinDbg symbol path and setting up debugging symbols for WinDbg in Windows.
In this article I explain how to set up debugging symbols for WinDbg in Windows. The Microsoft public symbol server provides free access to Windows debugger symbols, enabling developers to debug Windows applications efficiently. This service allows you to configure symbol paths that automatically download and cache debugging symbols from Microsoft’s servers.
Setting WinDbg symbol path
Assuming you’ve already installed WinDbg through the Windows SDK sdksetup.exe program, the steps to set debugging symbols path for WinDbg are pretty easy and straightforward:
- Start WinDbg
- Click File
- Click Symbol File Path (shortcode Ctrl+S)


- Fill in a new Symbol Path:
SRV*D:\SymCache*http://msdl.microsoft.com/download/symbols - Click OK
- Click Save Workspace in the File menu
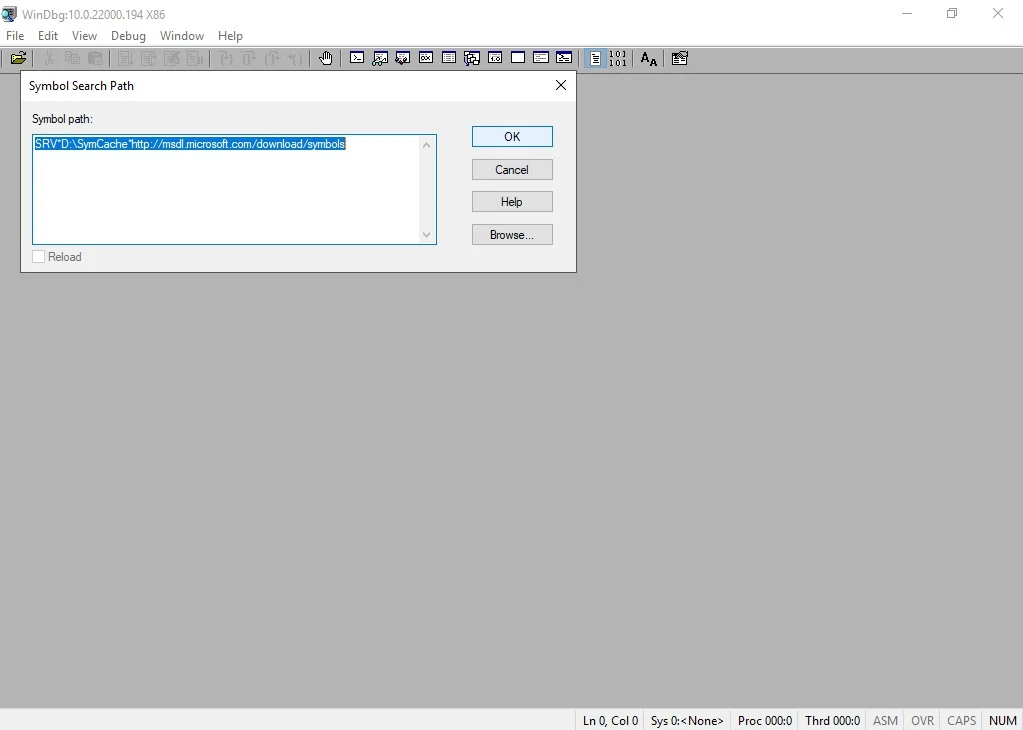

The path D:\SymCache is specific to my environment. If the target folder of your choosing doesn’t yet exist, it’ll be created.
All done, now you can debug BSOD like a boss 🙂 .
Want to dive into fundamental concepts that are important for understanding debugging and troubleshooting complex issues on Windows? Then check out this GitHub repo by “DebugPrivilege“: https://github.com/DebugPrivilege/InsightEngineering. Each section goes beyond just the theory aspects, emphasizing practical examples using tools like Visual Studio, Process Explorer, and WinDbg.
Found this guide helpful? You can support my independent deep dives into Windows Server and DevOps by donating via PayPal. Every bit of support helps keep saotn.org fast and updated!
In WinDbg App 1.2506.12002.0
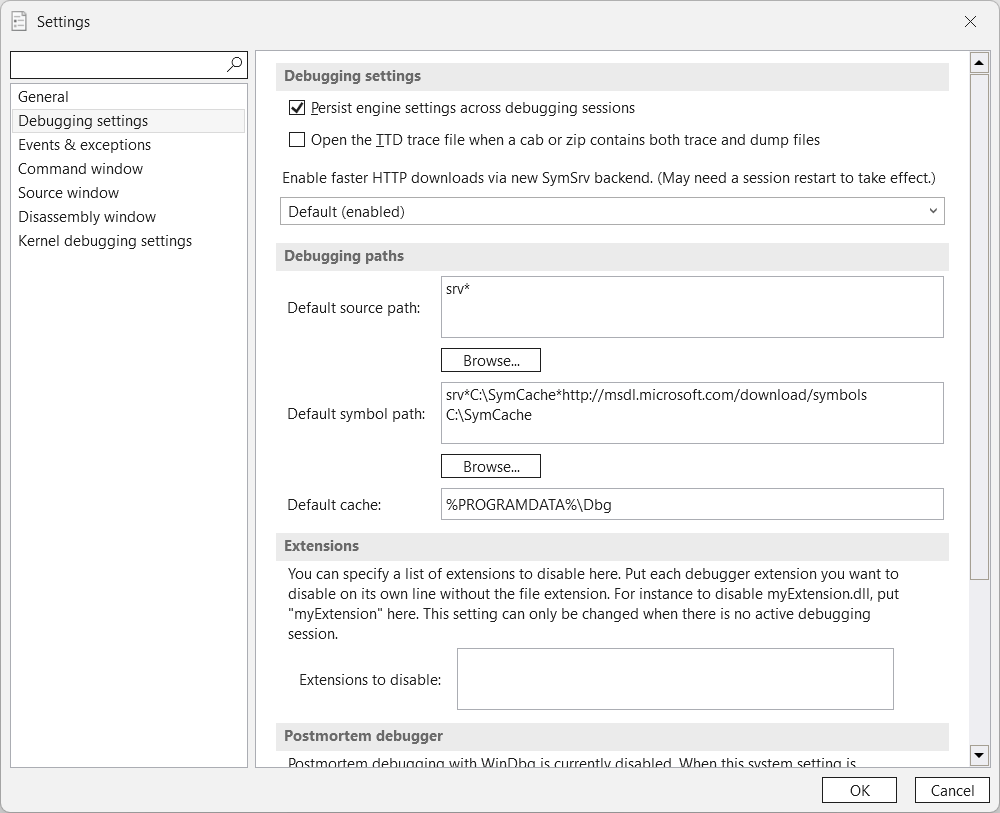
WinDbg App 1.2506.12002.0 has a different look and feel (whoop whoop, that was about time 🙂 ), but the steps remain somewhat the same:
- click File
- click Settings
- click Debugging settings
- add the Default source path and Default symbol path location under Debugging paths and click OK
_NT_SYMBOL_PATH
Besides setting the debugging symbol path in the WinDBG GUI, you can also create an environment variable _NT_SYMBOL_PATH referencing the paths. If you set the _NT_SYMBOL_PATH or _NT_ALT_SYMBOL_PATH environment variable, the symbol handler searches for symbol files in the following order:
- The directory that contains the corresponding module.
- The
_NT_SYMBOL_PATHenvironment variable. - The
_NT_ALT_SYMBOL_PATHenvironment variable.
Setting the environment variable:
- The most trivial setting for this variable is:
_NT_SYMBOL_PATH=srv*http://msdl.microsoft.com/download/symbols - If you were to create a downstream store to cache the files locally, set it to:
_NT_SYMBOL_PATH=srv*C:\SymCache*http://msdl.microsoft.com/download/symbols(whereC:\SymCacheis an absolute path to a directory created for that purpose)
PowerShell one-liner:
[System.Environment]::SetEnvironmentVariable("_NT_SYMBOL_PATH", "srv*C:\SymCache*https://msdl.microsoft.com/download/symbols", "Machine")Setting it at the Machine scope ensures the symbol path is available for elevated administrator sessions, background services, and all server users.
This abbreviated view works perfectly in the environment variable, but you may encounter the older syntax in a lot of documentation:
symsrv*symsrv.dll*C:\SymCache*https://msdl.microsoft.com/download/symbolsMultiple symbol servers
When your organisation uses an internal symbol server for in-house compiled .exe / .dll files, you can combine multiple symbol paths in a _NT_SYMBOL_PATH environment variable using a semicolon:
_NT_SYMBOL_PATH = srv*C:\SymCache*https://msdl.microsoft.com/download/symbols;\\internal-symserver\symbolsYou can read all about advanced SymSrv use here and here.
My post How to set SVN_EDITOR environment variable in Windows Server provides more information about setting environment variables.
Reload Symbol cache in WinDbg
After changing the variable while having WinDbg open in the background, you’ll notice the path is not yet active. Therefor you must reload the symbol cache using these commands:
.symfix C:\SymCache(automatically sets up the default Microsoft Symbol Server).reload /f(forces the direct reloading of all symbols)
Symbol cache disk space usage
The symbol cache can eat up tens of gigabytes, easily. If your production server has limit disk space available, it is recommended to clean up the symbol cache folder when are is not much disk space to spare:
Remove-Item C:\SymCache\* -Recurse -ForceModern Alternative: downloading symbols via .NET CLI (dotnet-symbol)
If you are working in a lightweight server environment, container, or simply prefer command-line tools over the WinDbg GUI, Microsoft provides the dotnet-symbol tool. This allows you to automatically fetch all required PDBs and modules for a crash dump directly from the Microsoft Symbol Server:
dotnet tool install -g dotnet-symbol
dotnet-symbol --output C:\symbols\ C:\path\to\crashdump.dmp
Conclusion
It is important to properly set-up WinDbg debugging symbols, because they allow you to:
- make crash dumps human-readable: Without symbols, WinDbg can’t show you meaningful function or variable names. You’ll see cryptic addresses and memory locations instead of helpful names like
nt!KeBugCheckEx. - see accurate call stacks. Symbols allow WinDbg to reconstruct the call stack properly. This is critical when trying to trace what function calls led up to the crash.
- understand parameters and locals. With symbols, you can examine function parameters and local variables to understand what caused the fault – for example, a null pointer or invalid memory reference.
- identify driver issues. If a third-party driver causes the crash, symbols help identify exactly which driver and even the exact line of code or function within it.
- use WinDbg commands effectively. Commands like
!analyze -v,k,kv,ln, anddtall rely on symbols to display meaningful information. Without symbols, these commands are mostly useless.
Summary
- Install WinDbg and configure debugging symbols to analyze crash dumps effectively.
- Set the Symbol Path in WinDbg using the specified command for easier debugging.
- Using correct symbols makes crash dumps readable and helps trace issues accurately.
- Symbols allow identification of driver-related problems and enhance command utility in WinDbg.
- Tailor the path based on your environment to ensure that all necessary files are accessible.