SQL Server performance monitoring with Zabbix: Keeping your SQL Server and databases in top shape is key for a good performing SQL Server database server and its databases. A good performing server makes happy customers, and that’s what puts bread on the plank, right? In this post I’ll show you how you can use Windows Performance counters, PowerShell and Zabbix for in depth monitoring of your MS SQL Server and databases.
I wrote about Zabbix monitoring before, for example how you can monitor the performance of IIS application pools in Zabbix. In this post I’ll address four types of monitoring for SQL Server for you. Keep SQL Server and databases in top shape and performance up!
- SQL Server service state – are SQL Server and SQL Server Agent in a running state?
- SQL Server Job Monitoring – monitor Microsoft SQL Server Job statuses
- SQL Server Performance Counters – monitor various aspects using Windows Performance Counters
- SQL Server worker threads
Prior experience with PowerShell, Zabbix and Windows Performance Counters is recommended, because I won’t go into full detail. Please note that I’m not providing you with 100% complete XML or YAML templates for Zabbix and I expect you to be able to create or add Zabbix configuration and UserParameters.
Let’s start with basic SQL Server service state monitoring.
Basic SQL Server service state monitoring
You want to be sure SQL Server runs and SQL Server Agent too. And if your setup uses Distributed Transaction Coordinator (MSDTC), you’ll want that one running as well. Luckily, Zabbix offers us some basic item keys specific to Windows: Windows-specific item keys.
The item keys you need are service.info, to monitor services and net.tcp.service to see if an TCP port is used. This latter one is not Windows specific but a simple check.
Create four (4) items:
<key>service.info[MSSQLSERVER]</key><key>service.info[SQLSERVERAGENT]</key><key>service.info[MSDTC]</key><key>net.tcp.service[tcp,,1433]</key>
As you know, TCP port 1433 is SQL Server’s default port, so it’s recommended to check if that port is in use.
Value maps
Because net.tcp.service[tcp,,1433] returns 0 for service is down and 1 for service is running, you need to create a logical value mapping. Doing so enables you to display “Up” and “Down” in Zabbix which makes more sense than 0 or 1.
Create a value map named “Service state”:
<valuemap>
  <name>Service state</name>
  <mappings>
    <mapping>
      <value>0</value>
      <newvalue>Down</newvalue>
    </mapping>
    <mapping>
      <value>1</value>
      <newvalue>Up</newvalue>
    </mapping>
  </mappings>
</valuemap>
Add a value map for Windows service state as well:
<valuemap>
  <name>Windows service state</name>
  <mappings>
    <mapping>
      <value>0</value>
      <newvalue>Running</newvalue>
    </mapping>
    <mapping>
      <value>1</value>
      <newvalue>Paused</newvalue>
    </mapping>
    <mapping>
      <value>3</value>
      <newvalue>Pause pending</newvalue>
    </mapping>
    <mapping>
      <value>4</value>
      <newvalue>Continue pending</newvalue>
    </mapping>
    <mapping>
      <value>5</value>
      <newvalue>Stop pending</newvalue>
    </mapping>
    <mapping>
      <value>6</value>
      <newvalue>Stopped</newvalue>
    </mapping>
    <mapping>
      <value>7</value>
      <newvalue>Unknown</newvalue>
    </mapping>
    <mapping>
      <value>255</value>
      <newvalue>No such service</newvalue>
    </mapping>
    <mapping>
      <value>2</value>
      <newvalue>Start pending</newvalue>
    </mapping>
  </mappings>
</valuemap>
Microsoft has more information about “ServiceControllerStatus Enum“, the ServiceController class to check the current status of the services.
Triggers
If desired you can add triggers to alert you about failing services, for example:
<expression>last(/Microsoft SQL Server/net.tcp.service[tcp,,1433])=0</expression>
<name>SQL Server port on {HOST.NAME} unreachable</name>
<priority>WARNING</priority>
As you can see, my template’s called “Microsoft SQL Server”. This trigger expression checks whether the last check resulted in a 0 (down) and triggers an event / notification “SQL Server port on unreachable” if it did. The priority is WARNING.
For the service checks MSSQLSERVER, MSSQLSERVERAGENT and MSDTC you can use a check “is not 0” in your trigger, because Windows services have a different state as seen in the value map above.
<expression>last(/Microsoft SQL Server/service.info[MSSQLSERVER])<>0</expression>
<name>SQL Server on {HOST.NAME} is down</name>
<priority>WARNING</priority>
<expression>last(/Microsoft SQL Server/service.info[SQLSERVERAGENT])<>0</expression>
<name>SQL Server Agent on {HOST.NAME} is down</name>
<priority>WARNING</priority>
<expression>last(/Microsoft SQL Server/service.info[MSDTC])<>0</expression>
<name>Distributed Transaction Coordinator service (MS DTC) on {HOST.NAME} is down</name>
<priority>WARNING</priority>Make triggers manual closeable, add to your trigger:<manual_close>YES</manual_close>
If you add these four items in a template you have your basic SQL Server service monitoring template ready. Nice! (-: Let’s continue with some more specific monitoring templates.
Monitor SQL Server Agent Jobs
If you create an SQL Server Agent job, you want the job to run or be alerted if it doesn’t, right? The path for this to happen is twofold:
- You need to auto discover all SQL Server Agent Jobs
- Get the Job status of each job and send its last status to Zabbix.
Get SQL Server Agent Job status in PowerShell
A PowerShell script is what I use as in a Zabbix UserParameter. The script does both, depending on the argument you provide it with.
<#
Get SQL Server Job status
#>

param ([Parameter(Position=0, Mandatory=$False)][string] $action = "discovery")

function Get-SqlJobStatus($job) {
  $sqljobstatus = Invoke-SqlCmd -Query "use msdb; select x.name, max(last_status) as last_status from ( select j.job_id, j.name, first_value(h.run_status) over (partition by j.job_id order by h.run_date desc, h.run_time desc) as last_status from msdb.dbo.sysjobs j left join msdb.dbo.sysjobhistory h on h.job_id = j.job_id where j.enabled = 1 ) x where x.last_status IS NOT NULL and x.name = '${job}' group by x.job_id, x.name"
  return @{
    "name" = $sqljobstatus.name
    "last_status" = $sqljobstatus.last_status
  }
}

$allsqljobs = (Invoke-SqlCmd -Query "use msdb; select j.name from msdb.dbo.sysjobs j where j.enabled = 1").Name

switch ($action) {
    "discovery" {
        @{
            "data" = $allsqljobs | foreach { @{
                "{#SQLJOB}" = $_
            }}
        } | ConvertTo-Json
    }
    "getjobstatus" {
        $jobstatuses = @{}
        $allsqljobs | foreach {
            $jobstatuses[$_] = Get-SqlJobStatus $_
        }

        $jobstatuses | ConvertTo-Json
    }
    default {
        "Script error"
    }
}
As you can see, its default action is to list all available SQL Server Jobs (“discovery”) and if requested by command line argument, the status of a job is looked up and returned. All returned in JSON.
Zabbix UserParameter configuration
Add the following in a Zabbix UserParameter configuration file:
UserParameter=FetchSQLJobs[*],powershell -NoProfile -ExecutionPolicy Bypass -File C:\zabbix\scripts\mssqljobstatus.ps1 getjobstatus
UserParameter=FetchSqlJob,powershell -NoProfile -ExecutionPolicy Bypass -File C:\zabbix\scripts\mssqljobstatus.ps1
Restart Zabbix Agent after making configuration changes.
SQL Server Job Monitoring template
The magic where all comes together is in the template. For this you can create one normal item, which will serve as a master item. First create your item and let’s call it “FetchSQLJobs“, because it fetches all SQL jobs.
<item>
  <name>SQLJobFetcher</name>
  <key>FetchSQLJobs</key>
  <delay>5m</delay>
  <history>0</history>
  <trends>0</trends>
  <value_type>TEXT</value_type>
</item>
Secondly, create a discovery rule using your newly created item as master item. One item to retrieve the jobs and one to get the status. They’re fed by the PowerShell script.
<item_prototypes>
  <item_prototype>
    <name>DbJobFetch for {#SQLJOB}</name>
    <type>DEPENDENT</type>
    <key>DbJobFetch[{#SQLJOB}]</key>
    <delay>0</delay>
    <history>0</history>
    <trends>0</trends>
    <value_type>TEXT</value_type>
    <description>Master item</description>
    <preprocessing>
      <step>
        <type>JSONPATH</type>
        <parameters>
          <parameter>$['{#SQLJOB}']</parameter>
        </parameters>
        <error_handler>DISCARD_VALUE</error_handler>
      </step>
      <step>
        <type>DISCARD_UNCHANGED_HEARTBEAT</type>
        <parameters>
          <parameter>10m</parameter>
        </parameters>
      </step>
    </preprocessing>
    <master_item>
      <key>FetchSQLJobs</key>
    </master_item>
  </item_prototype>
  <item_prototype>
    <name>{#SQLJOB} Status</name>
    <type>DEPENDENT</type>
    <key>mssql.jobstatus[{#SQLJOB}]</key>
    <delay>0</delay>
    <history>1w</history>
    <preprocessing>
      <step>
        <type>JSONPATH</type>
        <parameters>
          <parameter>$.last_status</parameter>
        </parameters>
        <error_handler>DISCARD_VALUE</error_handler>
      </step>
    </preprocessing>
    <master_item>
      <key>DbJobFetch[{#SQLJOB}]</key>
    </master_item>
    <tags>
      <tag>
        <tag>Application</tag>
        <value>SQL Server Job status</value>
      </tag>
    </tags>
  </item_prototype>
</item_prototypes>
SQL Server agent Job Triggers
ou can add triggers if you want to, for example if a job failed or is still running:
<trigger_prototypes>
  <trigger_prototype>
    <expression>last(/MS SQL Server Job Monitoring/mssql.jobstatus[{#SQLJOB}])=0</expression>
    <name>SQL Job {#SQLJOB} failed on {HOST.NAME}</name>
    <priority>WARNING</priority>
    <manual_close>YES</manual_close>
  </trigger_prototype>

  <trigger_prototype>
    <expression>last(/MS SQL Server Job Monitoring/mssql.jobstatus[{#SQLJOB}])=4</expression>
    <name>SQL Job {#SQLJOB} still running on {HOST.NAME}</name>
    <priority>INFO</priority>
    <manual_close>YES</manual_close>
  </trigger_prototype>
</trigger_prototypes>
The triggers check the last status code. You can find the return codes for job statuses in dbo.sysjobhistory. There you notice 4 is “In Progress” and 0 is “failed”.
SQL Server performance monitoring
In Windows Performance Counters there are a lot of counters you can use to monitor the performance of your server. A lot of the performance counter items I describe here come from great blogposts like Brent Ozar‘s SQL Server Perfmon (Performance Monitor) Best Practices, MSSQLTips Windows Performance Monitor Counters for SQL Server, SQL Authority, and others. Key is to find the right documentation about counters you can use, and then make a decision whether to use them or not.
In my “Monitor Microsoft SQL Server with Zabbix” template I have no auto discovery items, just regular performance counter items and therefore I’ll describe the counters to use and their description in a nutshell.
The item key perf_counter_en is one I used before, and is a Windows specific item key.
<key>perf_counter_en["\Paging File(_Total)\% Usage"]</key>- Type: FLOAT
- Keeping an eye on this counter will help you know when you are encountering memory issues, and you can then take action to resolve the conflicts.
<key>perf_counter_en["\SQLServer:Access Methods\Forwarded Records/sec", 60]</key>- Type: FLOAT
- Helps you understand how fragmented your heaps are. A heap is a SQL Server table without a clustered index, and SQL Server uses Row IDs to find the data it’s looking for. Average per minute.
<key>perf_counter_en["\SQLServer:Access Methods\Full scans/sec", 60]</key>- Type: FLOAT
- The number of unrestricted full table or index scans per second. This value should also be very close to 0. Average per minute.
<key>perf_counter_en["\SQLServer:Access Methods\Page Splits/sec", 60]</key>- Type: FLOAT
- If SQL Server needs to insert a row onto a page, and there isn’t room, SQL Server will split the page into multiple pages, move rows from one page to another to balance the pages out, and then insert the row. Average per minute.
<key>perf_counter_en["\SQLServer:Buffer Manager\Buffer cache hit ratio"]</key>- Type: FLOAT
- On older SQL Server systems (think SQL Server 2000 and earlier) this counter would help you understand the percentage of times the needed page was already in the buffer pool when it was needed. On today’s system it’s mostly useless, but many older DBA managers still ask for it, so it doesn’t hurt to capture this counter.
<key>perf_counter_en["\SQLServer:Buffer Manager\Checkpoint pages/sec", 60]</key>- Type: FLOAT
- This counter shows the number of dirty pages that are moved from the SQL buffer pool to disk during a checkpoint. The number of pages that you would expect to be moved per second depends a lot on your system and its usage. If this counter is higher than normal you can use indirect checkpoints to reduce the number of pages flushed per second. Average per minute.
<key>perf_counter_en["\SQLServer:Buffer Manager\Page life expectancy"]</key>- Type: INTEGER
- Page Life Expectancy value indicates the memory pressure in allocated memory to the SQL Server instance.
<key>perf_counter_en["\SQLServer:Buffer Manager\Page lookups/sec", 60]</key>- Type: FLOAT
- Indicates the number of requests per second to find a page in the buffer pool. Average per minute.
<key>perf_counter_en["\SQLServer:Buffer Manager\Page reads/sec", 60]</key>- Type: FLOAT
- Indicates the number of physical database page reads that are issued per second. Average per minute. This statistic displays the total number of physical page reads across all databases. Because physical I/O is expensive, you may be able to minimize the cost, either by using a larger data cache, intelligent indexes, and more efficient queries, or by changing the database design.
<key>perf_counter_en["\SQLServer:General Statistics\Processes blocked"]</key>- Type: INTEGER
- When this counter goes outside the normal range (for your system) you’ll want to investigate and see what might be causing the issue
<key>perf_counter_en["\SQLServer:General Statistics\User Connections"]</key>- Type: INTEGER
- This measures the number of current connections to SQL Server. As with the “Batch Requests/Sec” counter this counter is simply a good indicator for how busy your SQL Server instance is, more users usually leads to more queries which leads to more resource usage.
<key>perf_counter_en["\SQLServer:Locks(Database)\Average Wait Time (ms)"]</key>- Type: INTEGER
- The average amount of time waited in milliseconds for each lock request that resulted in a wait.
<key>perf_counter_en["\SQLServer:Locks(Database)\Lock Waits/sec", 60]</key>- Type: FLOAT
- The number of lock requests per second that required the lock requestor to wait. Average per minute.
<key>perf_counter_en["\SQLServer:Locks(_total)\Average Wait Time (ms)"]</key>- Type: FLOAT
- The average amount of time waited in milliseconds for each lock request that resulted in a wait.
<key>perf_counter_en["\SQLServer:Locks(_total)\Lock Waits/sec", 60]</key>- Type: FLOAT
- The number of lock requests per second that required the lock requestor to wait. Average per minute.
<key>perf_counter_en["\SQLServer:Memory Manager\Memory Grants Pending"]</key>- Type: INTEGER
- This is defined as the total number of SQL Server processes that are waiting for workspace memory to be granted. If you are not experiencing any memory pressure then this value should almost always be zero.
<key>perf_counter_en["\SQLServer:Memory Manager\Target Server Memory (KB)"]</key>- Type: INTEGER
- Indicates the amount of memory that SQL Server can potentially consume.
- Value: B (byte)
<key>perf_counter_en["\SQLServer:Memory Manager\Total Server Memory (KB)"]</key>- Type: INTEGER
- Specifies the amount of memory the server has committed using the memory manager.
- Value: B (byte)
<key>perf_counter_en["\SQLServer:SQL Statistics\Batch Requests/sec", 60]</key>- Type: FLOAT
- The Batch Requests/sec metric provides information about the number of SQL batches SQL Server received in one second. Average per minute.
<key>perf_counter_en["\SQLServer:SQL Statistics\SQL Compilations/sec", 60]</key>- Type: FLOAT
- These counters will increment when SQL Server has to compile or recompile query plans because either the plan in cache is no longer valid, or there’s no plan in cache for this query. Average per minute.
<key>perf_counter_en["\SQLServer:SQL Statistics\SQL Re-Compilations/sec", 60]</key>- Type: FLOAT
- These counters will increment when SQL Server has to compile or recompile query plans because either the plan in cache is no longer valid, or there’s no plan in cache for this query. Average per minute.
<key>perf_counter_en["\SQLServer:Transactions\Free Space in tempdb (KB)"]</key>- Type: INTEGER
- The amount of space (in kilobytes) available in tempdb. There must be enough free space to hold both the snapshot isolation level version store and all new temporary objects created in this instance of the Database Engine.
- Value: B (byte)
<key>perf_counter_en["\SQLServer:Transactions\Transactions"]</key>- Type: INTEGER
- The number of currently active transactions of all types.
<key>perf_counter_en["\System\Processor Queue Length"]</key>- Type: INTEGER
- The Processor Queue Length counter tells you the number of threads that are waiting for time on the system processor. If this number is greater than 0, that means that there are more requests per core than the system can handle, and this can be a cause for significant performance issues. Average per minute.
For items representing bytes (having “(KB)” in their name), be sure to set a correct unit value: B (for Byte).
SQL Server worker threads monitoring
A SQL Server worker thread, also known as worker or thread, is a logical representation of an operating system thread. When executing serial requests, the SQL Server Database Engine spawns a worker to execute the active task (1:1)
It is recommended to monitor the worker threads that are available in your SQL Server server. This number is calculated by querying the total worker threads minus the sum of all used threads, this gives you available worker threads. In your monitoring scripts you can use the following queries:
SELECT max_workers_count AS [TotalThreadsAvailable] FROM sys.dm_os_sys_info;SELECT SUM (active_workers_count) AS [UsedThreads] FROM sys.dm_os_schedulers;Let’s return a JSON with the three metrics total, used and available:
$totalThreads = Invoke-Sqlcmd -ServerInstance . -Encrypt Optional -Query "SELECT max_workers_count AS [TotalThreadsAvailable] FROM sys.dm_os_sys_info;"
$usedThreads = Invoke-Sqlcmd -ServerInstance . -Encrypt Optional -Query "SELECT SUM (active_workers_count) AS [UsedThreads] FROM sys.dm_os_schedulers;"
[int] $availableThreads = $totalThreads.Item(0) - $usedThreads.item(0)
$hashtable = @{
TotalThreads = $totalThreads.item(0)
UsedThreads = $usedThreads.item(0)
availableThreads = $availableThreads
}
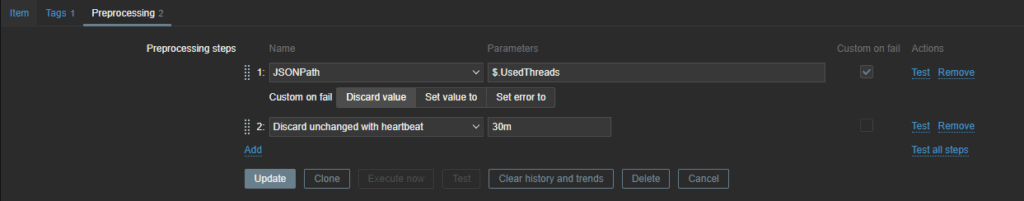
return $hashtable | ConvertTo-JsonAdd this to your template as an item with three dependent items. Don’t forget your JSONPath preprocessing step, for example for UsedThreads:
Fix broken WMI provider in SQL Server
Conclusion and giveway
You can use Zabbix and PowerShell / WMI / PerfCounters to monitor a lot in Microsoft SQL Server. It takes time to learn what is valuable information and what is not, so you best start with a few monitoring items that you can easily expand upon. It has my preference to create small templates for different types of monitoring. The three types I showed you here are in three different templates of mine.
I hope you found this monitor Microsoft SQL Server with Zabbix post interesting and can use the items in your own SQL Server monitoring. Let me know in a comment, thanks! Now don’t forget to inspect the results from time to time 🙂

Did you like this post?
Please take a second to support Sysadmins of the North and donate!
Your generosity helps pay for the ongoing costs associated with running this website like coffee, hosting services, library mirrors, domain renewals, time for article research, and coffee, just to name a few.