Monitor Microsoft SQL Server, databases and performance with Zabbix, PowerShell, Performance Counters and WMI. Keep SQL Server and databases in top shape and performance up! In this post I show you how you can use Zabbix to monitor those important aspects for database administrators (DBA).
WMI stopped working: WmiPrvse.exe would just crash after hitting some memory limit of 512 MB. If you run into the same issue with Windows Management Instrumentation, here is how you can increase WMI Provider Service’s memory quota. Doing so resolved my issues: learn to optimize WMI Provider Host and decrease high CPU usage.
This is part 3 about Zabbix monitoring for your websites and ASP.NET applications in IIS. This time I'll show you how to get data from Win32_PerfRawData_PerfProc_Process counter, fast, for everey application pool This counter is notorious for its slowness, but you can get data a bit faster. IIS AppPool Insights in Zabbix - because there is always more than one way.
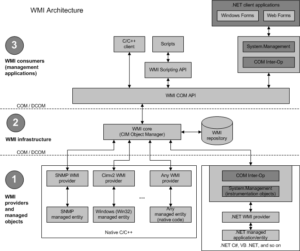
Zabbix can harnas the powers of WMI (Windows Management Instrumentation) to query the Windows system for data. In Zabbix you use wmi.getall for this. Here is a small introduction to query the number of running w3wp.exe processes per IIS application pool in Zabbix.
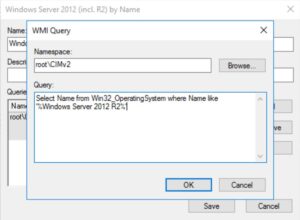
Create effective WMI filters for Group Policy to have a more granular control on specific versions of Windows Server. In this post I provide some basic WMI filter examples to use with Group Policy Objects (GPOs).
Detect the ethernet network speed using PowerShell or WMI is perfect for Windows Server Core. If you ever need to lookup the speed of your ethernet network card in Windows, on the command-line, use one of the following WMIC commands on your PowerShell prompt
How to add DNS servers -or resolvers- to a Windows Server network adapter, or interface using WMI and the netsh command. This one is quite old but may come in handy sometimes. In this example we use Google's Public DNS server addresses and localhost to add as DNS Servers on our server.