Before you can properly debug crash and memory dumps in Windows (Windows 11, Windows 10, Windows Server), you need to install WinDbg -Windows Debugger- and its debugging symbols. In this article I explain how to set up these debugging symbols for WinDbg in Windows.
Assuming you've already installed WinDbg through the Windows SDK sdksetup.exe program, the steps to configure Windows debugging symbols in WinDbg are pretty easy and straightforward:
- Start WinDbg
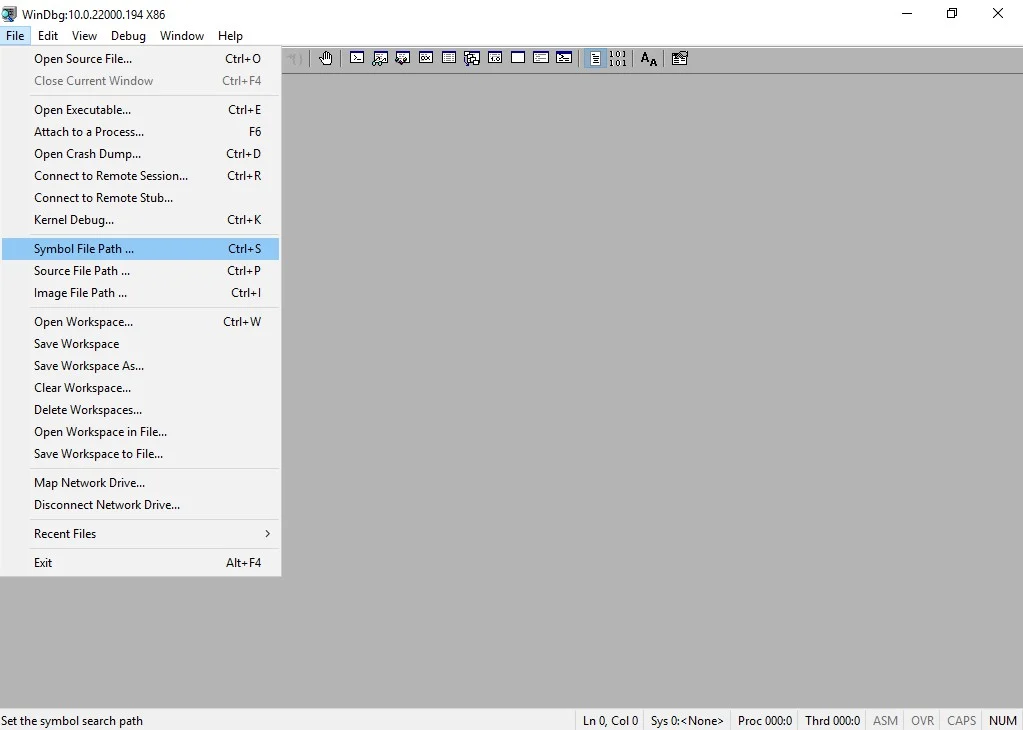
- Click File
- Click Symbol File Path (shortcode Ctrl+S)
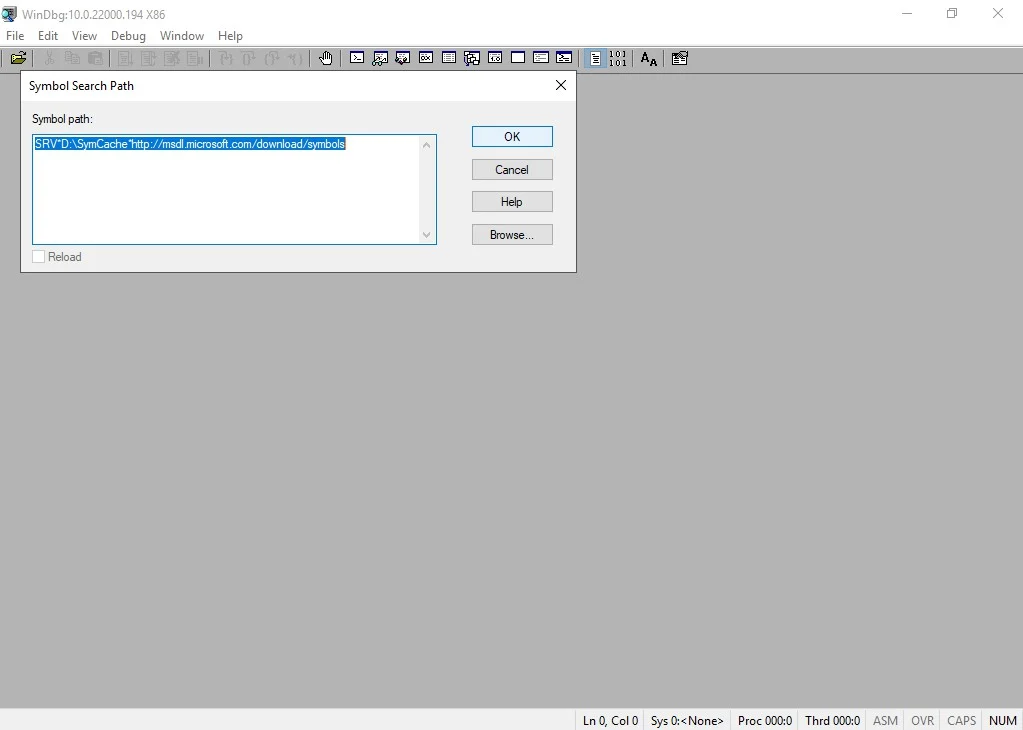
- Fill in a new Symbol Path: SRV*D:\SymCache*http://msdl.microsoft.com/download/symbols
- Click OK
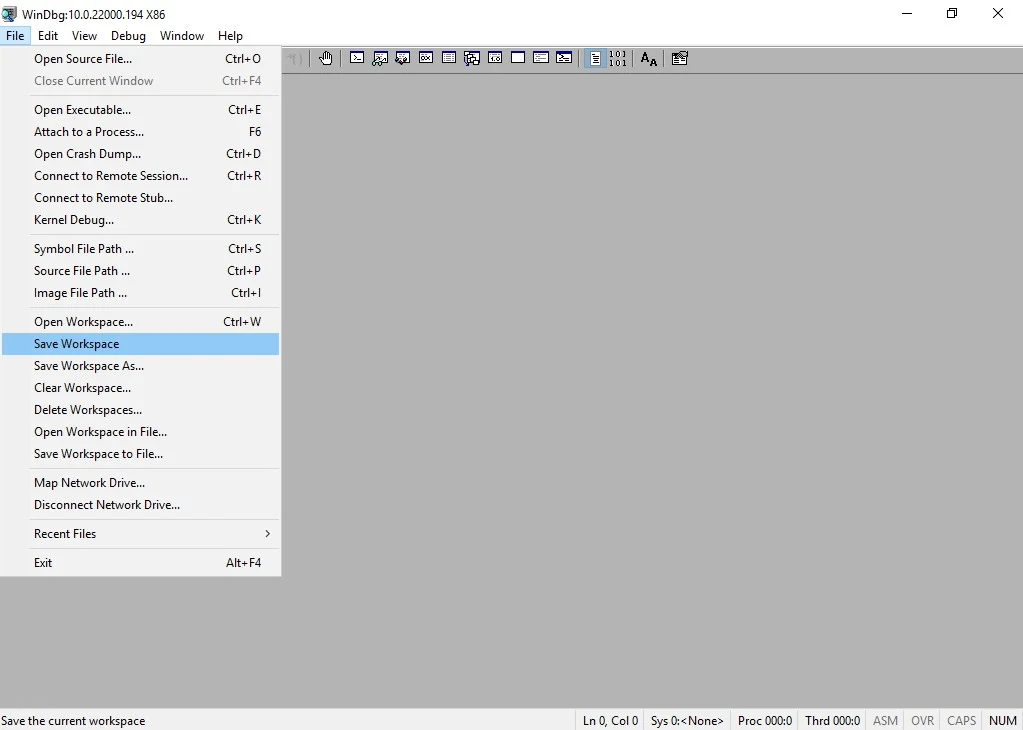
- Click Save Workspace in the File menu
The path D:\SymCache is specific to my environment. If the target folder of your choosing doesn't yet exist, it'll be created.
All done, now you can debug BSOD like a boss.
Want to dive into fundamental concepts that are important for understanding debugging and troubleshooting complex issues on Windows? Then check out this GitHub repo by "DebugPrivilege": https://github.com/DebugPrivilege/InsightEngineering. Each section goes beyond just the theory aspects, emphasizing practical examples using tools like Visual Studio, Process Explorer, and WinDbg.

Thank you very much! <3 ❤️

Hi, my name is Jan. I am not a hacker, coder, developer or guru. I am merely an application manager / systems administrator, doing my daily thing at Embrace – The Human Cloud. In the past I worked at CLDIN (CLouDINfra) and Vevida. With over 20 years of experience, my specialties include Windows Server, IIS, Linux (CentOS, Debian), security, PHP, websites & optimization. I blog at https://www.saotn.org.
